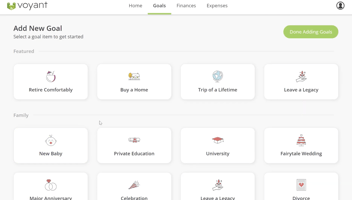
We’re thrilled to announce a more engaging, collaborative and interactive client experience with...
NEW RELEASE: Chart Improvements
Here at Voyant, we’ve always thought seeing is believing. Our latest AdviserGo release makes visualizing a plan that much simpler, with easier to access chart options. Let’s take a look at what’s ahead.
Chart View & Selection
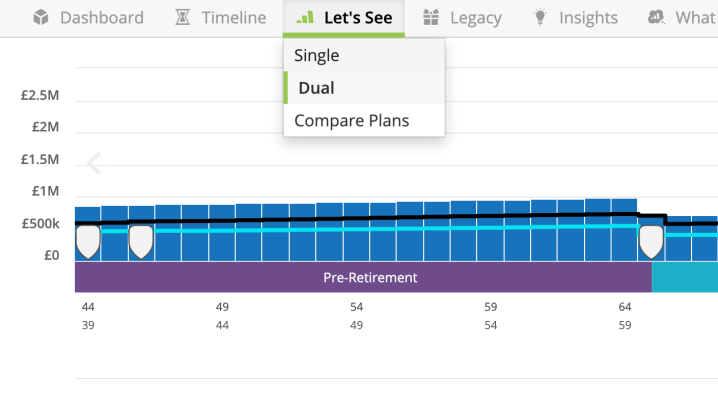
Select a chart view by visiting one simple dropdown menu in Let’s See. One spot holds all the chart view controls you love for complete control and simple access:
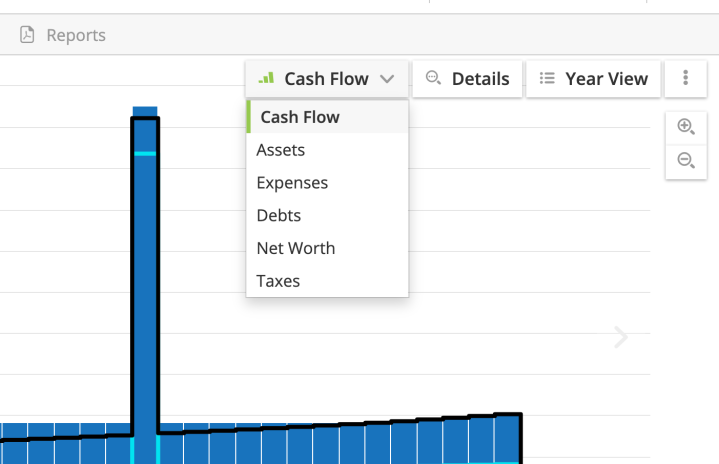
Likewise, you can now control the chart type selection from one dropdown menu:
Easy Presentation In Chart View
We’ve made it easier than ever to view yearly chart details. Simply hover over a year to see the details, without needing to mouse your cursor over a filled-in chart bar:
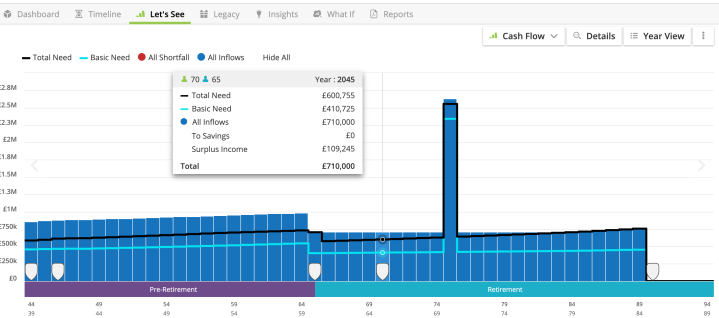
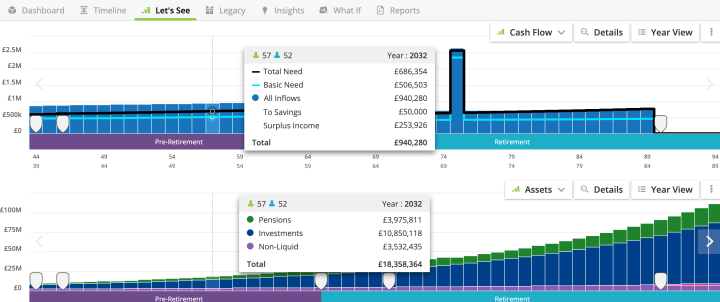
Presenting two charts simultaneously? Hover over a year in either chart to display the year details of both charts. You can do this with both Compare Plans or Dual view:
Individualized Toggling
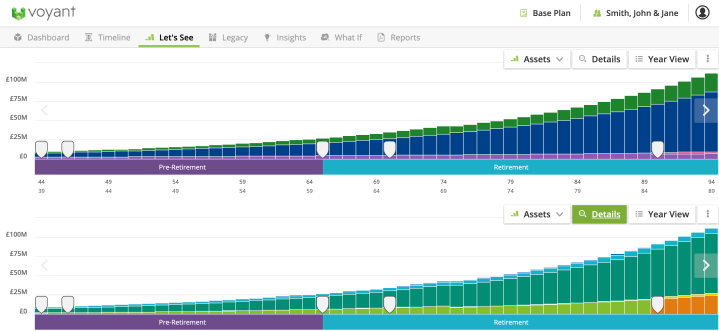
You can now toggle chart details for an individual chart when in dual chart mode. For instance, you can show your clients a detailed view of a cash flow chart alongside a simple view of the same chart:
Zoom Feature
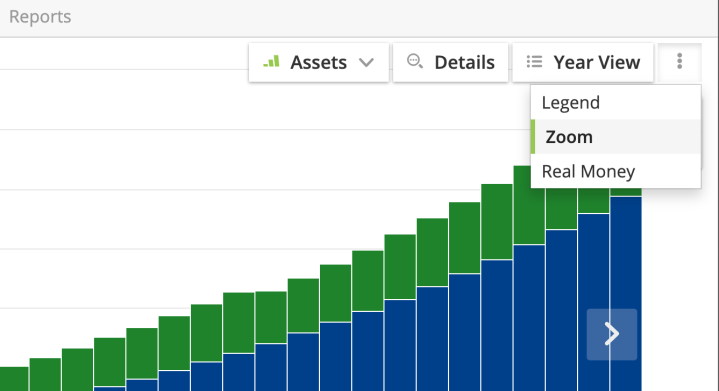
Our latest zoom feature allows you to zoom in on specific aspects of a plan, such as a life stage like Retirement, or exclude exceptional spikes caused by incidents such as asset liquidation. This allows you to get ultra-specific while presenting a plan to a client, all without leaving Let’s See. Simply click “Zoom” from the options icon:
Use an intuitive slider for horizontal (time) zooming:
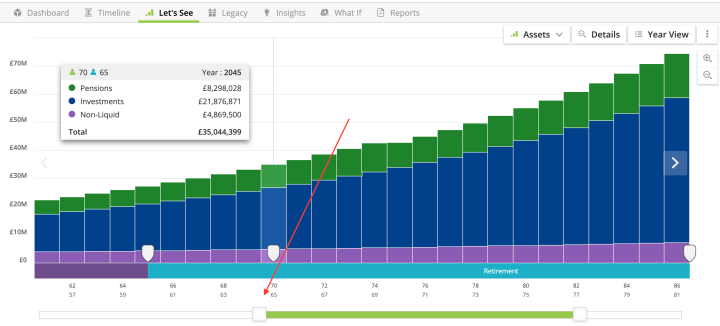
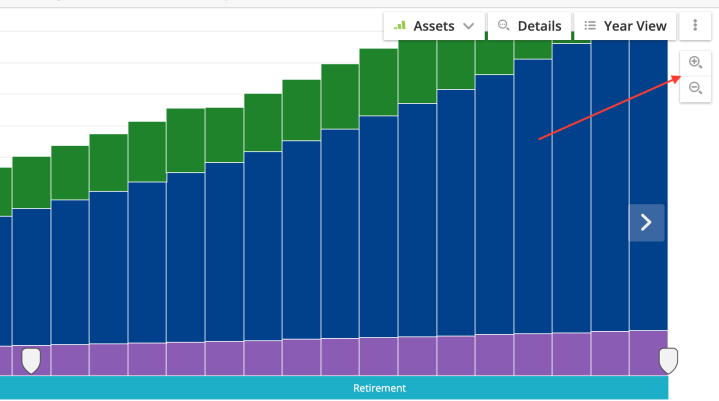
Use zoom buttons for vertical (value) zooming:
Purpose: Usability Means Power
AdviserGo has robust functionality to visualize and compare plans under a variety of scenarios. Our latest update means these functionalities are simpler to access, making the planning experience even more powerful for you and your clients. Further readings are available on Voyant’s Support page. Please contact support@planwithvoyant.com if you have any further inquiries.
